Creatives play a key role in any digital marketing campaign. Whether it’s a branding or a performance campaign, the creatives used have a big impact on how users react and interact with your brand and product. Although many platforms are moving in the direction of taking control away from marketers in the name of “automating performance,” they still allow and encourage marketers to experiment with different creatives and then let their algorithm decide which creative drives the best performance. While having the ability to run an A/B test is great, unfortunately, a black box A/B test where an algorithm eventually decides the winner doesn’t always empower the marketing and creative teams to understand which specific nuances of the creative made it perform better than others. Data-driven marketers prefer to have an initial hypothesis, love to dig deep in the data, test multiple creative versions and use statistically significant metrics to approve or disprove the hypothesis. Hence, it’s no surprise that we have seen tremendous interest from savvy marketers to use Kayzen’s In-Ad Event functionality for testing multiple creative concepts and driving conclusions from transparent and observable data points.
What’s In-Ad Event functionality?
Simply put, the in-ad event functionality enables marketers to embed Kayzen’s Event APIs in the creatives so they can analyze and learn how users are interacting with each creative element. These insights can be used to answer many questions such as
- “Are my users closing the ad after 5 sec or 15 sec?”
- “Where exactly in the creative are users dropping off?”;
- “What’s the correlation between a specific in-ad event and IPM’s”? and more
The API event integration is a simple one-line code that works seamlessly with existing reporting metrics and enables marketers to look at in-ad event results grouped by all available dimensions — like exchanges, geo, device model, traffic type, and many more.
Let’s talk data
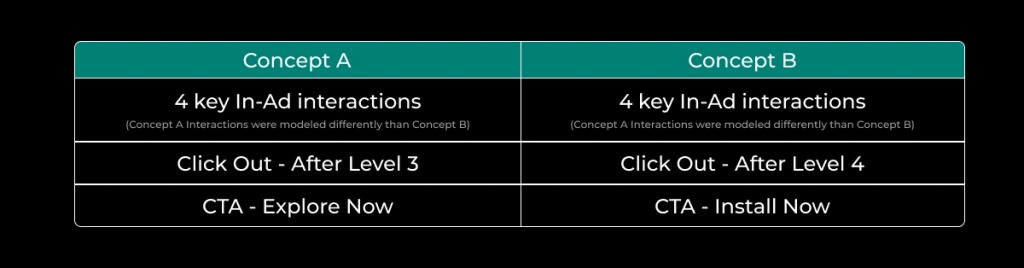
Here’s an example of how an advertiser used the in-ad event tracking functionality in Kayzen. The advertiser was running a playable creative for a casual game. The playable creative depicts actual game behavior. The customer had two new concepts to try and was interested in understanding which aspects of the playable ad have an impact on performance metrics like IPMs (Install per Mille). The concepts differed in various aspects. Both the concepts had four different in-ad mini-milestones. These are labeled as “in-ad interactions.” The in-ad interactions were different in Concept A vs. Concept B. In addition, there were other differences in the two concepts. For instance, click outs appeared at different stages and the CTA button had a varying text to name a few variations.
Creatives play a key role in any digital marketing campaign. Whether it’s a branding or a performance campaign, the creatives used have a big impact on how users react and interact with your brand and product. Although many platforms are moving in the direction of taking control away from marketers in the name of “automating performance,” they still allow and encourage marketers to experiment with different creatives and then let their algorithm decide which creative drives the best performance.
While having the ability to run an A/B test is great, unfortunately, a black box A/B test where an algorithm eventually decides the winner doesn’t always empower the marketing and creative teams to understand which specific nuances of the creative made it perform better than others. Data-driven marketers prefer to have an initial hypothesis, love to dig deep in the data, test multiple creative versions and use statistically significant metrics to approve or disprove the hypothesis. Hence, it’s no surprise that we have seen tremendous interest from savvy marketers to use Kayzen’s In-Ad Event functionality for testing multiple creative concepts and driving conclusions from transparent and observable data points.
What’s In-Ad Event functionality?
Simply put, the in-ad event functionality enables marketers to embed Kayzen’s Event APIs in the creatives so they can analyze and learn how users are interacting with each creative element. These insights can be used to answer many questions such as
- “Are my users closing the ad after 5 sec or 15 sec?”
- “Where exactly in the creative are users dropping off?”;
- “What’s the correlation between a specific in-ad event and IPM’s”? and more
The API event integration is a simple one-line code that works seamlessly with existing reporting metrics and enables marketers to look at in-ad event results grouped by all available dimensions — like exchanges, geo, device model, traffic type, and many more.
Let’s talk data
Here’s an example of how an advertiser used the in-ad event tracking functionality in Kayzen.
The advertiser was running a playable creative for a casual game. The playable creative depicts actual game behavior. The customer had two new concepts to try and was interested in understanding which aspects of the playable ad have an impact on performance metrics like IPMs (Install per Mille). The concepts differed in various aspects. Both the concepts had four different in-ad mini-milestones. These are labeled as “in-ad interactions.” The in-ad interactions were different in Concept A vs. Concept B. In addition, there were other differences in the two concepts. For instance, click outs appeared at different stages and the CTA button had a varying text to name a few variations.
 The customer ran an
The customer ran an A/B test and saw >100% increase in IPM for Concept A as compared to Concept B creative. While this is a good insight, the fact is that the marketing team could have obtained this insight from any other platform. However, rather than being content with the aggregated result, they were more interested in learning and understanding which elements of the playable creative actually drove this performance difference.
- Was it because of the way different interactions were modeled in each concept?
- Was it because the click out’s visibility and appearance varied across both the concepts?
- Did one CTA perform better than the other?
- Or was it because of something else?
The advertiser passed multiple events through Kayzen’s Event API based on different user interactions within the creatives. These included events like:
- Interaction with the playable across different in-ad game interactions
- Time spent between different interactions
- Closing the ad
- Measuring how long the user is interacting with the ad
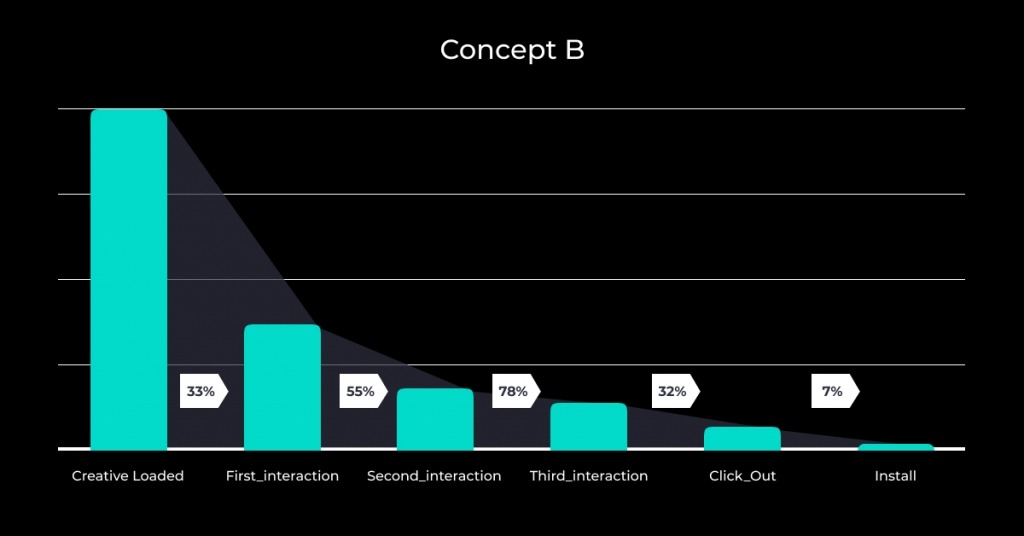
Here are the results:
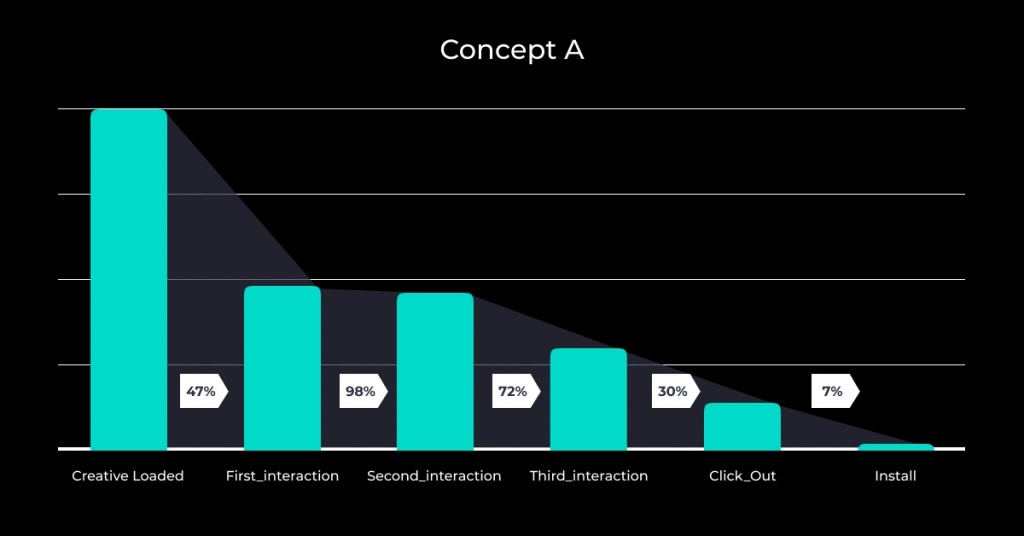
By analyzing data across multiple dimensions, the advertiser realized that the real difference in user engagement between the two concepts was the result of two primary factors:
- More users were dropping before finishing “First_interaction” in Concept B vs. Concept A. After the playable was fully loaded, 47% of users completed the “First_interaction” milestone in Concept A vs 33% of users in Concept B.
- There was a big drop off between first and second interaction in Concept B vs. Concept A. In fact, 98% of users who completed “First_interaction” moved to “Second_interaction” in Concept A. However, only 55% of such users moved to “Second_interaction” in Concept B. This gap was massive.
Although the third and fourth interactions were also modeled differently in both the creatives, there was not a significant difference in the drop ratio between these two interactions which meant the real difference in performance was coming from how the initial interactions were modeled. The differences in the CTA, positioning of click out and any other variation in the concept were not driving any statistically significant difference in the performance. Once the user was able to get the positive reinforcement of completing the first two interactions, they were more likely to go ahead and finish in the last two interactions, click out, and eventually install the app.
Armed with this insight, the advertiser was able to create multiple new playable ads which were modeled on Concept A and these creatives ended up outperforming the existing creatives.
This kind of detailed insight is difficult to get if you just let a black box model take care of selecting the “best” creatives. While letting the ML models select best-performing creatives and optimize for performance is definitely a best practice and I highly recommend it, however, when you are in the phase of testing different concepts, having a deep understanding of why one concept works over another is very important. It’s even more critical to relay this information back to the design team so it can build on the learnings and improve productivity (Kaizen philosophy – always keep on improving).
Another benefit of running these programmatic tests with a transparent platform is that you can analyze the results across multiple dimensions. Some of the insights that our advertisers have uncovered are:
- How creative loading ratios differ across exchanges — If the loading ratios look low for a specific exchange, chances are high that your playable creative is not adhering to guidelines suggested by the specific exchange. Without this knowledge, a marketer might think that a specific exchange does not work for them in terms of performance while, in reality, it may have the potential to outperform others once the technical nuances are sorted.
- Ad interaction behavior varies across locations — For instance, you can discover if people in the U.S. behave differently between interactions 1 and 2 of Concept A in comparison to people in South East Asia.
With the advent of ATT and the loss of IDFAs, creatives will continue to be one of the key elements driving performance. Since creative ID is not (yet) part of the SKAdNetwork postbacks, and with the stated 100 campaign limit, marketers can no longer just throw tons of creatives at a platform and let the model test different variations of these creatives. These changes make it even more important for the marketing team to analyze the few creatives that they can test in a more granular way so as to make more intelligent and data-driven decisions.
In my next blog, I’ll talk about how we are leveraging creative interaction data to train our ML models to better predict performance for LAT traffic.